联系我们
竺可桢-南森国际研究中心
邮 箱:nzc_iap@mail.iap.ac.cn
邮 编:100029
地 址:北京市朝阳区德胜门外祁家豁子华严里40号 竺南中心
科研进展
Research Progress相比CMIP5,CMIP6模式能更好地模拟极端气候变化
Comparison of CMIP6 and CMIP5 models in simulating climate extremes
[2020-08-07]
【中文介绍】
近期,第六次全球耦合模式比较计划(CMIP6)的试验结果已逐渐对外公开发布。相比CMIP5模式,CMIP6模式无论在动力学参数化方案还是模式分辨率等方面,都有了较大的改进和提高。那么,CMIP6模式对气候尤其是极端气候的模拟性能如何?相比之前模式版本,是否有所提升呢?针对这一问题,中国科学院大气物理研究所陈活泼研究员、孙建奇研究员等开展了系统的评估研究,研究成果以“News & Views”的形式发表在《Science Bulletin》期刊。
研究选取五种典型的极端气候作为评估对象,包括高温(TXx)、低温(TNn)、暴雨(R20mm)、洪涝(RX5day)和干旱(CDD)。整体上来说,相比CMIP5中的旧版本模式,基于CMIP6中新版本模式的集合结果能够更好地模拟这些极端气候的平均态以及趋势变化特征,其模拟结果与观测更为接近。但是对于单个模式来说,模式间的差异较大,甚至有个别模式对这些极端气候的模拟性能相比CMIP5版本有所降低,比如MPI-ESM1-2-HR相比MPI-ESM-LR。随着未来全球的进一步增暖,全球陆地区域的最高温及最低温均呈现出了一致的增加,这也意味着未来发生高温热浪天气的概率明显增加,而发生低温冷害的风险在降低;此外,未来全球陆地区域发生暴雨和洪涝的概率也在显著增加,但干旱(基于降水异常)增加只局限在南半球陆地区域。同时发现,CMIP6模式预估的未来这些极端气候的增加幅度明显要高于CMIP5的结果,而且其不确定性也相对较大,这还有待进一步深入研究。
【英文介绍】
CMIP6 models exhibit a general improvement in simulation of climate extremes and their trend patterns compared to observations. The model spread among CMIP6 models tends to be much smaller than that among their predecessors, particularly for regions in the high northern latitudes. However, the improvement is limited or even decreased for some individual models, which still needs further explanation from other perspectives. In response to further warming in the future, the TXx and TNn show a general increase in this century, but the increase in TNn is much greater than that in TXx. Additionally, precipitation indices of R20mm and RX5day are projected to significantly increase across lands, while increase in CDD is limited to the Southern Hemisphere. These changes are generally more pronounced in CMIP6 than CMIP5 simulations, but the model spreads are still comparable between CMIPs, which still needs further investigation.
【关键图表】
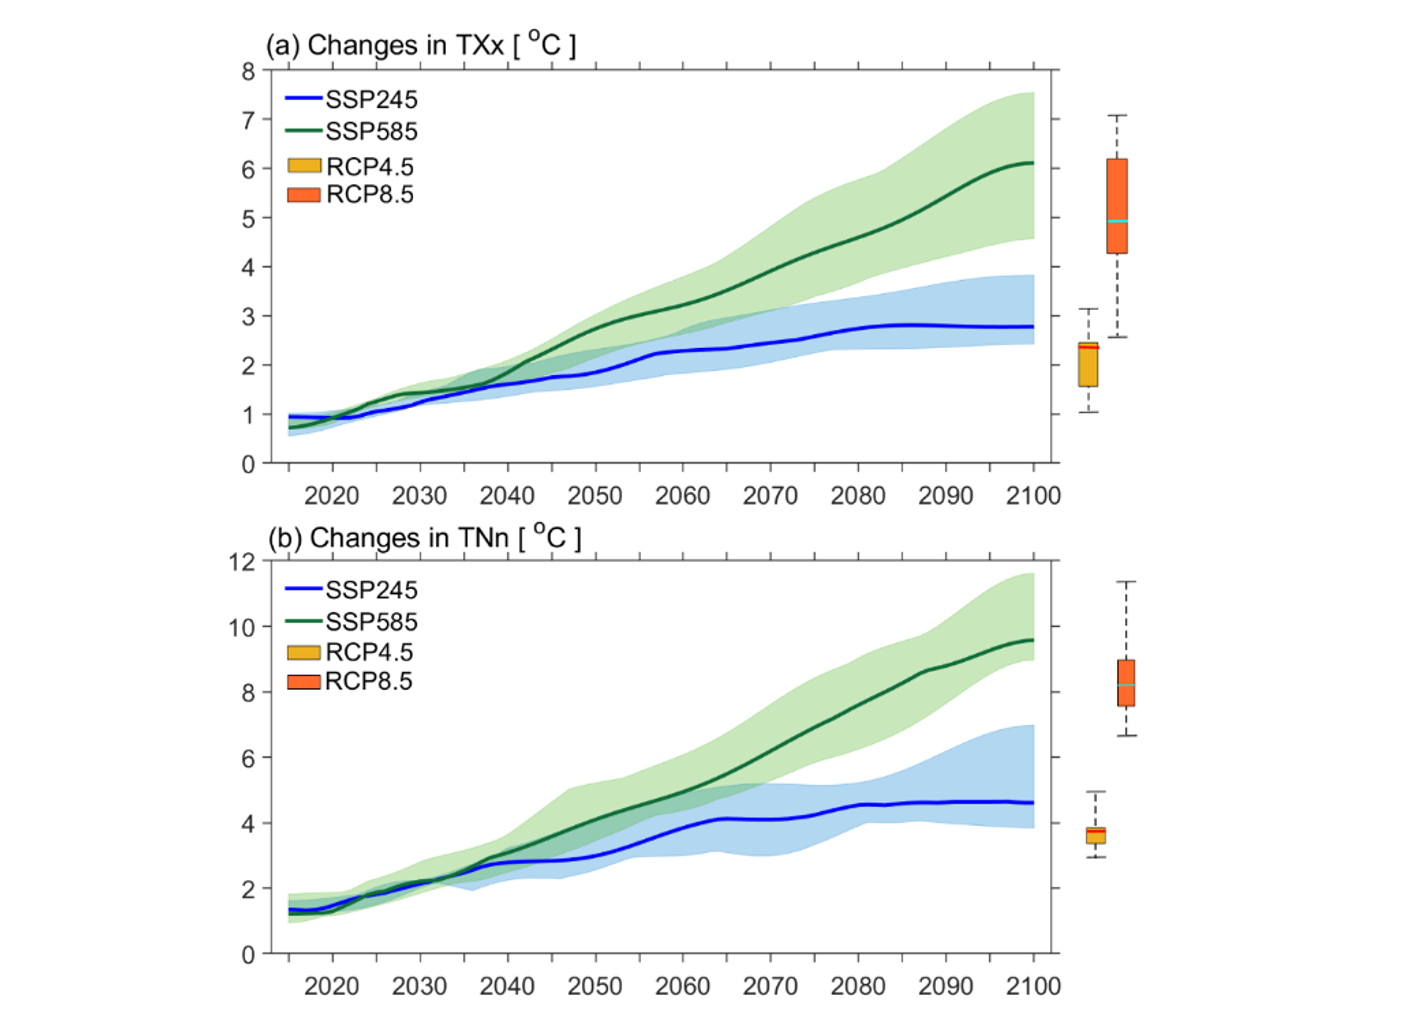
图:CMIP6(曲线)和CMIP5(盒须图)多模式集合预估的未来全球陆地区域平均的最高温(TXx)、最低温(TNn)相对当前气候(1986-2005年)的变化。
Figure: Projected changes of temperature indices of (a) TXx and (b) TNn averaged over the global land estimated from the CMIP6 ensemble for the SSP245 (blue) and SSP585 (green) scenarios that displayed as anomalies from the reference period 1986-2005. For comparison, the box-and-whisker plots show the interquartile ensemble spread (box) and outliers (whiskers) for the CMIP5 model simulations of the RCP4.5 (orange) and RCP8.5 (red) scenarios at the end of 21st century (2081-2100) with respect to the reference period 1986-2005.
【引用格式】
Chen, H. P., J. Q. Sun, W. Q. Lin, and H. W. Xu, 2020: Comparison of CMIP6 and CMIP5 models in simulating climate extremes. Science Bulletin, 65(17): 1415-1418.


版权所有:竺可桢-南森国际研究中心
竺可桢-南森国际研究中心
邮 箱:nzc_iap@mail.iap.ac.cn
邮 编:100029
地 址:北京市朝阳区德胜门外祁家豁子华严里40号 竺南中心