联系我们
竺可桢-南森国际研究中心
邮 箱:nzc_iap@mail.iap.ac.cn
邮 编:100029
地 址:北京市朝阳区德胜门外祁家豁子华严里40号 竺南中心
科研进展
Research ProgressSimulated change in soil temperature on the Tibetan Plateau from 1901 to 2010
[2017-12-13]
【内容介绍】
Frozen ground change is a hot issue in the research regarding climate change, and soil temperature is an important parameter for research on frozen ground change. However, the change in soil temperature at deep layer has not be well understood on a centenary time-scale. This study investigates the change in soil temperature on the Tibetan Plateau over the past a hundred years using the latest version of Community Land Model (CLM), CLM4.5, driven by the default forcing dataset of CRUNCEP in the model. The in situ observations from both weather station and field borehole monitoring site were collected to validate the simulated results. The results show that (1) the CLM can reproduce change in soil temperature, and the results are superior to reanalysis data. (2) Soil temperature at 15 m depth increased by 0.05(0.27)℃ decade−1 on the Tibetan Plateau during 1901–2010 (1979–2010). The increase in the soil temperature is larger in winter than summer. Increase in soil temperature decreased along with increasing depth and longitude and first increased and then slightly decreased along with increasing latitude. (3) Change in soil temperature on the Tibetan Plateau is mostly influenced by air temperature. Sensitivity of soil temperature at 1 m (15 m) depth to air temperature change is 0.79 (0.37) ℃ ℃−1. Soil temperature at shallow layer is more sensitive than those at deep layer and permafrost temperature is more sensitive than seasonally frozen ground temperature. These results are useful for in-depth understanding the change in soil temperature on the Tibetan Plateau.
【引用格式】
Guo Donglin, Li Duo, and Guangyue Liu, 2017: Simulated change in soil temperature on the Tibetan Plateau from 1901 to 2010. Quaternary Science, 37, 1101–1109.
【全文链接】
http://www.dsjyj.com.cn/CN/abstract/abstract11390.shtml
【关键图表】
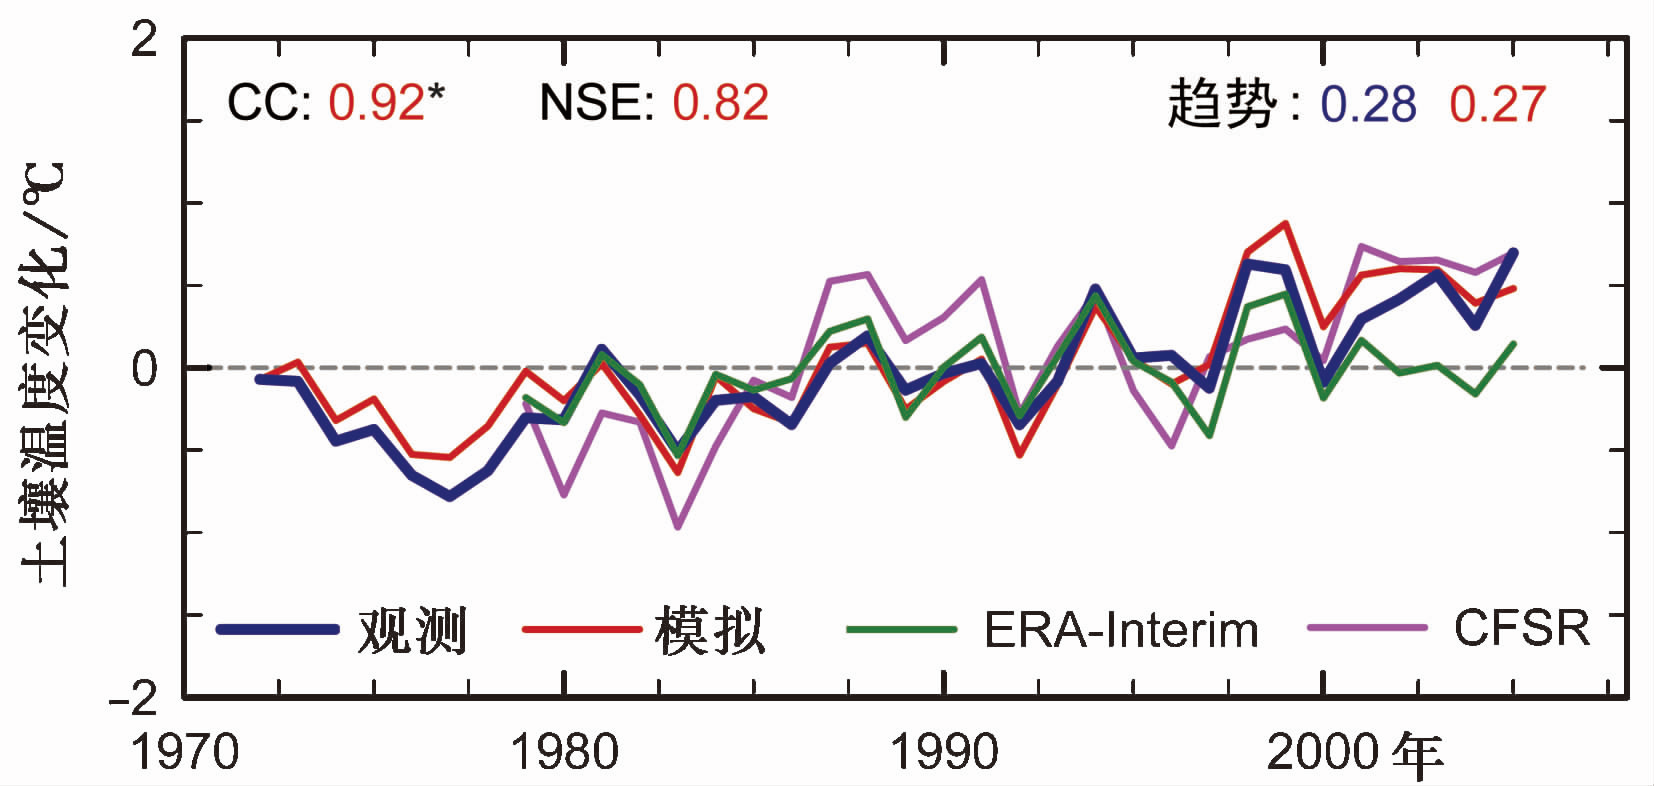
Figure 1. Comparison of simulated change in soil temperature at a depth of 0.2 m to observations and reanalysis data relative to 1980–2000. CC represents correlation coefficient, “*” represents the correlation coefficient exceeding 95% significance level, and NSE represents the Nash-Sutcliffe efficiency.

Figure 3. Distribution of trend in soil temperature (℃ decade−1) during the period 1901–2010 for meridional (a) and Latitudinal (b) mean over the Tibetan Plateau. “-” in the value of depth represent underground. Trends for all grids exceeding 95% significance level.
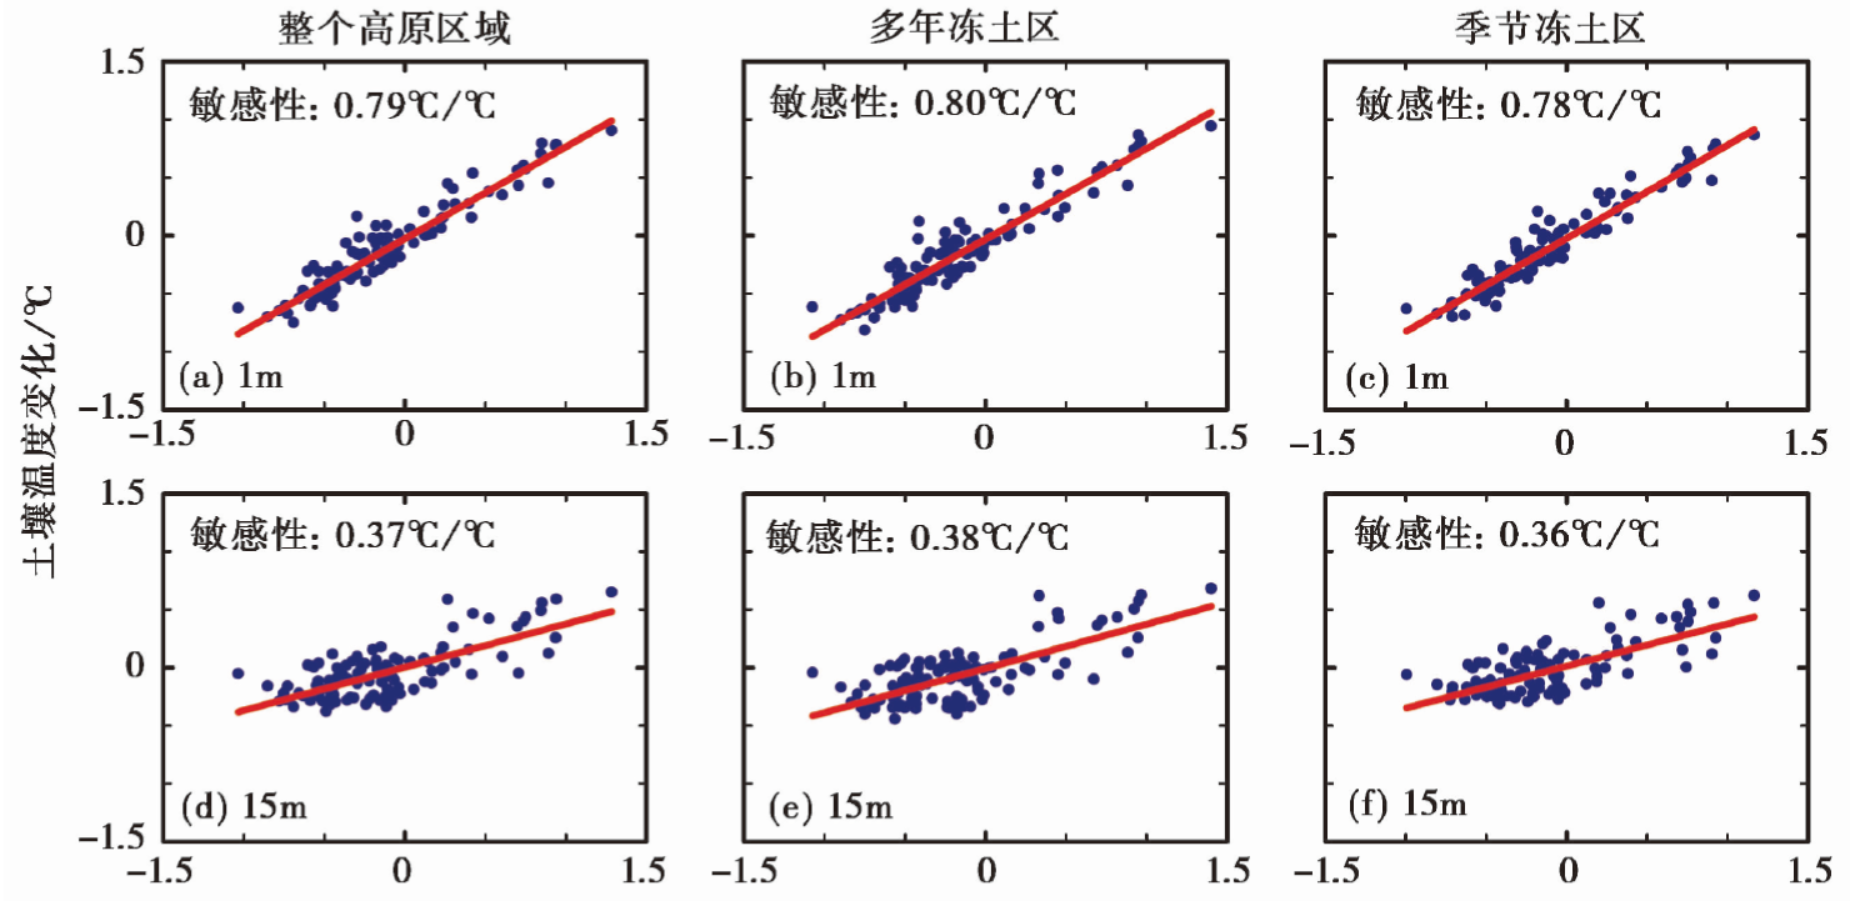
Figure 4. Relationship between soil temperature and air temperature changes at depths of 1 m (a, b, c) and 15 m (d, e, f) over entire Tibetan Plateau (a, d), permafrost (b, e), and seasonally frozen ground (c, f) regions during the period 1901–2010 relative to 1981–2000.


版权所有:竺可桢-南森国际研究中心
竺可桢-南森国际研究中心
邮 箱:nzc_iap@mail.iap.ac.cn
邮 编:100029
地 址:北京市朝阳区德胜门外祁家豁子华严里40号 竺南中心