联系我们
竺可桢-南森国际研究中心
邮 箱:nzc_iap@mail.iap.ac.cn
邮 编:100029
地 址:北京市朝阳区德胜门外祁家豁子华严里40号 竺南中心
科研进展
Research Progress中国区域日最高温度的统计降尺度
Application of the Bias Correction and Spatial Downscaling algorithm on the temperature extremes from CMIP5 multi-model ensembles in China
[2020-07-17]
【中文介绍】
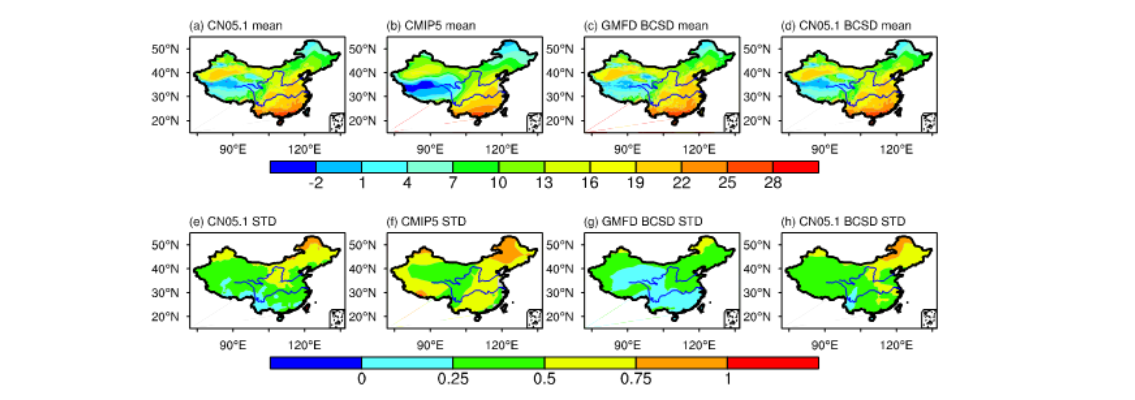
以中国区域站点观测数据(CN05.1)作为参照,基于BCSD方法,将CMIP5多模式模拟的2米日最高温度进行统计降尺度,构建了一套高精度数据集,并基于此数据研究了中国区域极端温度在未来的变化。与RCP4.5和RCP8.5相比,RCP2.6是唯一可以实现1.5 °C增暖目标的排放情景,但目前缺乏该情景下统计降尺度的气候数据集。利用BCSD方法,对13个CMIP5气候模式在RCP2.6情景下的2米日最高温度进行误差订正并降尺度到0.25°×0.25°。基于此降尺度数据,研究了中国区域极端温度在未来的变化,并与CMIP5多模式集合展开了详细比较。结果表明,BCSD统计降尺度方法显著减小了CMIP5多模式集合的日最高温度在全国范围内的冷偏差,尤其是在站点稀少的青藏高原地区;统计降尺度前后,日最高温度、夏日指数、年最高温度、热浪的强度和频率在2006-2065年期间均有微弱增加的趋势,且两套数据的趋势相差不大;统计降尺度后,CMIP5多模式集合的极端温度指数的模式不确定性显著减小。
【英文介绍】
The Bias Correction and Spatial Downscaling (BCSD) is a trend-preserving statistical downscaling algorithm, which has been widely used to generate accurate and high-resolution dataset. We employ the BCSD technique to statistically downscale projected daily maximum temperature (DMT) over China from 13 GCMs in CMIP5 project to supplement the NASA Earth Exchange Global Daily Downscaled Projections (NEX-GDDP) dataset under the RCP2.6 scenario. We then compare the differences of DMT and four DMT-related indices (i.e., summer days (SU), annual maximum value of DMT (TXx), intensity and frequency of heatwave) between before and after downscaling over eight sub-regions of China. The results indicate that the BCSD method reduces the cool bias of the DMT over the whole China compared with original CMIP5 simulations, especially over the Qinghai-Tibet Plateau. The SU increases after downscaling for both China as a whole and most sub-regions except for South China. The BCSD also affects the mean value of TXx, intensity and frequency of heatwave at sub-regional scales, although it shows little impact on China as a whole. Besides, the BCSD reduces the temporal variability of most indices except for the heatwave frequency. The most striking finding is that the inter-model spreads of DMT, SU, TXx and heatwave intensity are dramatically reduced after downscaling compared with raw CMIP5 simulations. In summary, the BCSD method shows significant improvements to original CMIP5climate projections under RCP2.6 scenario.
【关键图表】
【引用格式】
Xu LL, Wang AH. Application of the Bias Correction and Spatial Downscaling algorithm on the temperature extremes from CMIP5 multi-model ensembles in China. Earth and Space Science, 2019, 6: 2508-2524.


版权所有:竺可桢-南森国际研究中心
竺可桢-南森国际研究中心
邮 箱:nzc_iap@mail.iap.ac.cn
邮 编:100029
地 址:北京市朝阳区德胜门外祁家豁子华严里40号 竺南中心