联系我们
竺可桢-南森国际研究中心
邮 箱:nzc_iap@mail.iap.ac.cn
邮 编:100029
地 址:北京市朝阳区德胜门外祁家豁子华严里40号 竺南中心
科研进展
Research Progress卫星遥感资料揭示2001年以来青藏高原西南在变冷
Satellite data reveal southwestern Tibetan Plateau cooling since 2001 due to snow-albedo feedback
[2020-09-03]
【中文介绍】
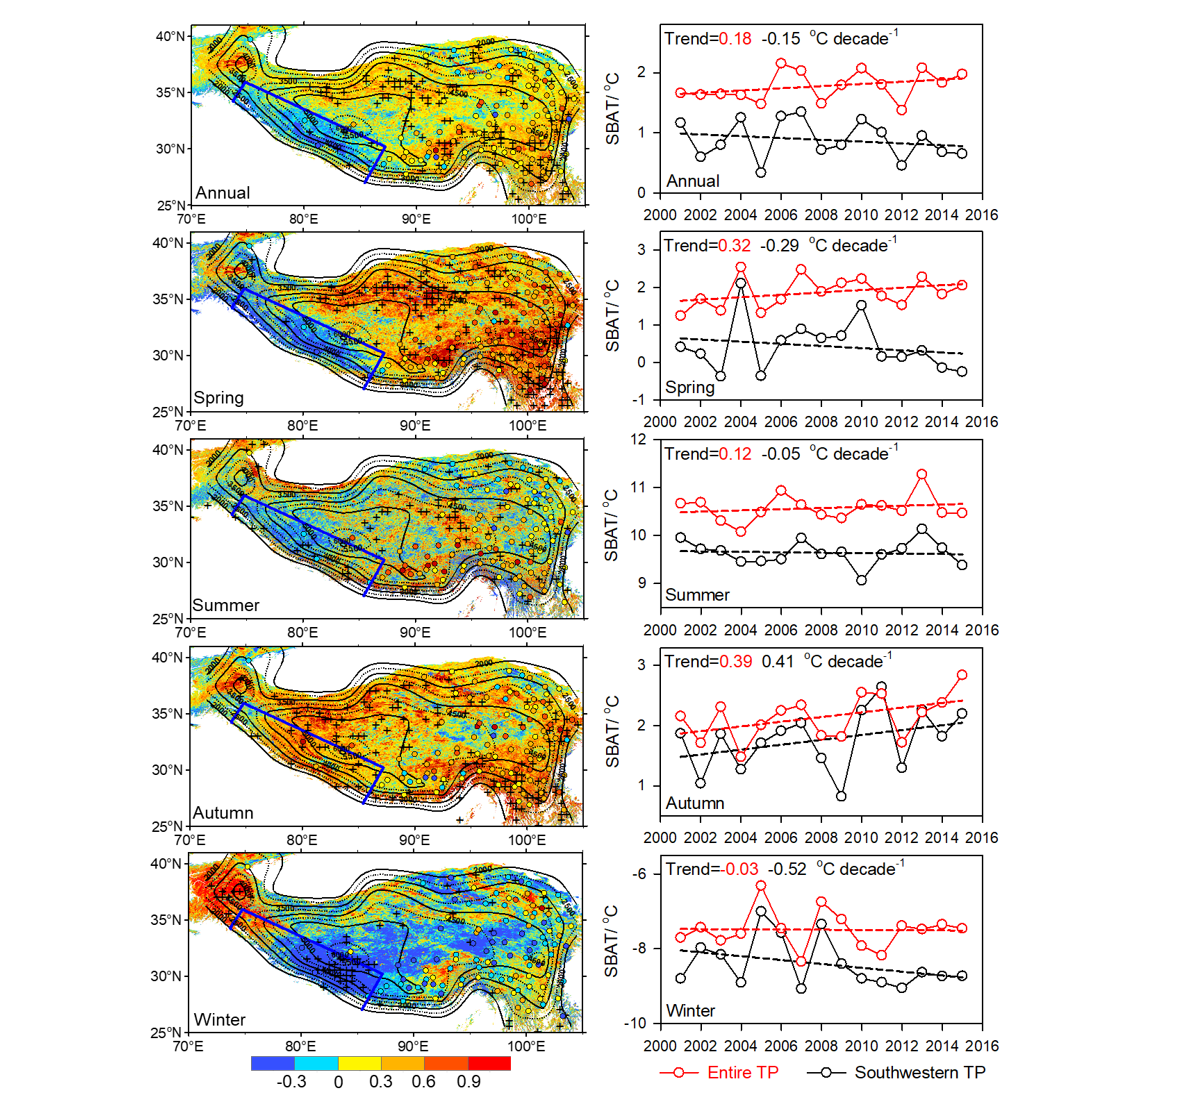
研究青藏高原气候变化在评估青藏高原固态水资源可持续性等方面具有重要意义。由于青藏高原观测资料稀少,造成对其气候变化的认识存在不足,特别是高原西南地区。利用2001–2015年的卫星资料(2m气温、地表温度、反照率和积雪),揭示了相对整个高原的增温(+0.18°C/10年),高原西南2m气温在降低(−0.15°C/10年)。同期积雪反照率变化能解释超过45%(74%)的高原西南年平均(春季)2m气温变化。高原西南和印度西北部的自由大气变冷,为上述2m气温降低提供了有利的气候环境。同时,进入高原西南的水汽传输异常增多有利于该地区降雪增加,进而促进2m气温降低。在全球变暖背景下,这种异常变冷对青藏高原西南部喜马拉雅山系的冰川和积雪保持具有重要意义。
【英文介绍】
Given the threats that climate change poses to solid water reservoirs on the Tibetan Plateau (TP), there is significant interest in understanding spatial patterns of climate change and their causes. Weather station observations have been extensively examined, but are scarce, resulting in an incomplete understanding of climate change across the TP, particularly in the west. Using recent (2001–2015) satellite-based data sets (2 m air temperature, land surface temperature, albedo and snow cover), this study reveals that mean annual 2 m air temperature in the southwestern TP has decreased by 0.15 °C decade−1 in contrast to overall warming (+0.18 °C decade−1) on the entire TP. Up to 45% (74%) of the variance in the annual (spring) 2 m air temperature can be explained by simultaneous change in snow-induced albedo in the southwestern TP. The free atmosphere column over this region and Northwest India is cooling, providing a favorable environment for the decrease in 2 m air temperature observed. Moreover, the anomalous water vapor transport into the southwestern TP is advantageous for increased snowfall and the associated decrease in 2 m air temperature. The implications of this anomalous cooling under global warming have yet to be fully considered, in particular for the futures of glaciers and snowpack over the Himalayan Mountains in the southwestern TP.
【关键图表】
【引用格式】
Guo Donglin, Sun Jianqi, Yang Kun, Pepin Nick, Xu Yongming, Xu Zhiqing, Wang Huijun, 2020: Satellite data reveal southwestern Tibetan Plateau cooling since 2001 due to snow-albedo feedback. International Journal of Climatology, 40, 1644–1655.


版权所有:竺可桢-南森国际研究中心
竺可桢-南森国际研究中心
邮 箱:nzc_iap@mail.iap.ac.cn
邮 编:100029
地 址:北京市朝阳区德胜门外祁家豁子华严里40号 竺南中心